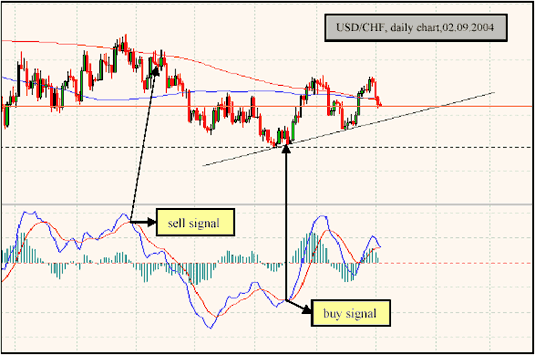
A key difference between Technical Analysis and Balance Sheet analysis is that the former uses the past performance of the share price to determine whether a company will make a good investment and the latter uses the past performance of the company itself.
Personally, I believe Balance Sheet analysis is better since it allows us to base our decisions on facts about the company. The past performance of a company’s shares does not necessarily reflect the true value of the company. It is obvious that a company's true "worth" does not change as frequently or dramatically as its share price. Therefore, it is important to get a rough estimate of a company's worth so that you can invest in it when its share price is attractive. This way you will not be buying simply because the shares are rising as is the case with using Technical Analysis.
Even though most people realize the importance of researching a company before making an investment, they either find it too time consuming or simply do not want to be bothered to look at a company's financial statements. They, therefore, depend on friends and family for investment advice. The advice usually amounts to "tips" on what is currently "hot" and a "must-buy" and as a bonus, the so-called "advisor" usually throws in a short-term prophecy on the stock market! All of these are recipe for an investment-related disaster.
The biggest problem people have is figuring out what companies to invest their hard-earned money in. Even with the Internet making available all information about a company right at your finger tips, it is still very time consuming to gather information on all companies and then investing in the most promising and "undervalued" ones. With thousands of companies listed on stock exchanges, it is no wonder that this is true.
After trying my luck with short-term trading, Technical Analysis and taking "tips" from others, I have realized that none of these things work over the long-term. Over the years, I have found that it is best to invest in companies that have the most "healthy" balance sheets - i.e. low debt and a high Net Tangible Asset value. But, another challenge is to find companies with the healthiest balance sheets amongst thousands of listed companies.
To make it easier for me to invest, I have setup Excel spreadsheets that contain all securities listed on the Toronto Stock Exchange, New York Stock Exchange, NASDAQ and American Stock Exchange - "Stock Guides".

Using JAVA programs that I wrote, I was able to extract the latest share prices, EPS and dividend information, balance sheet data (current assets, intangible assets, debt and more), from various web sites. These programs can be run as frequently as desired.
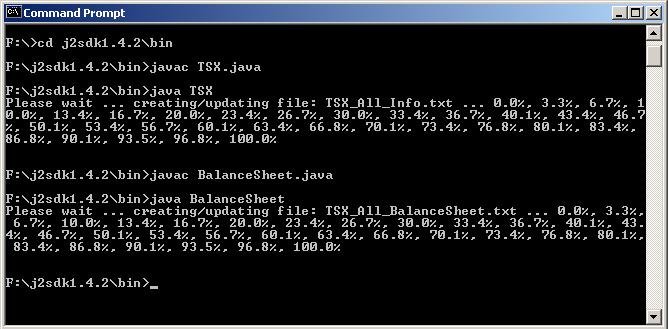
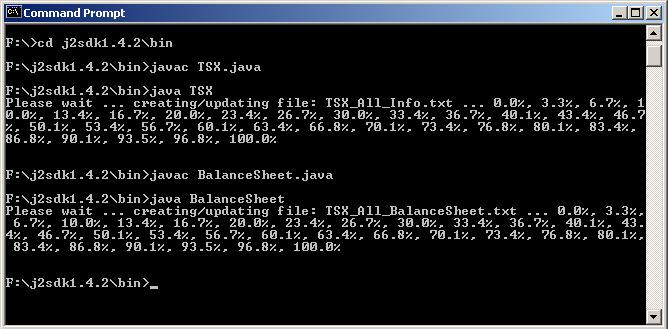
The JAVA programs are fed an input file containing "symbols" of all the listed companies or even a custom made list. The program feeds each symbol to a predefined web site (e.g. http://quotes.nasdaq.com/) that contains the necessary information and extracts the required data by analyzing the html file. The output of the programs is stored in text files. The data in the text files can then simply be copied onto the "stock guide" - i.e. Excel spreadsheet.
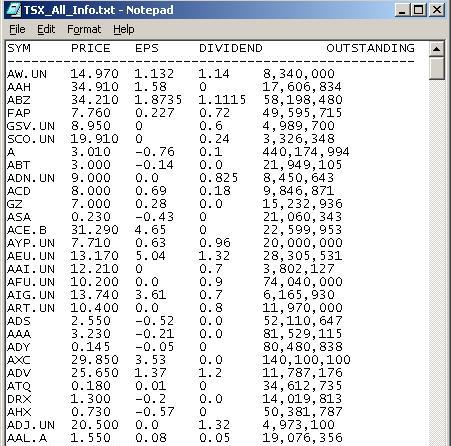
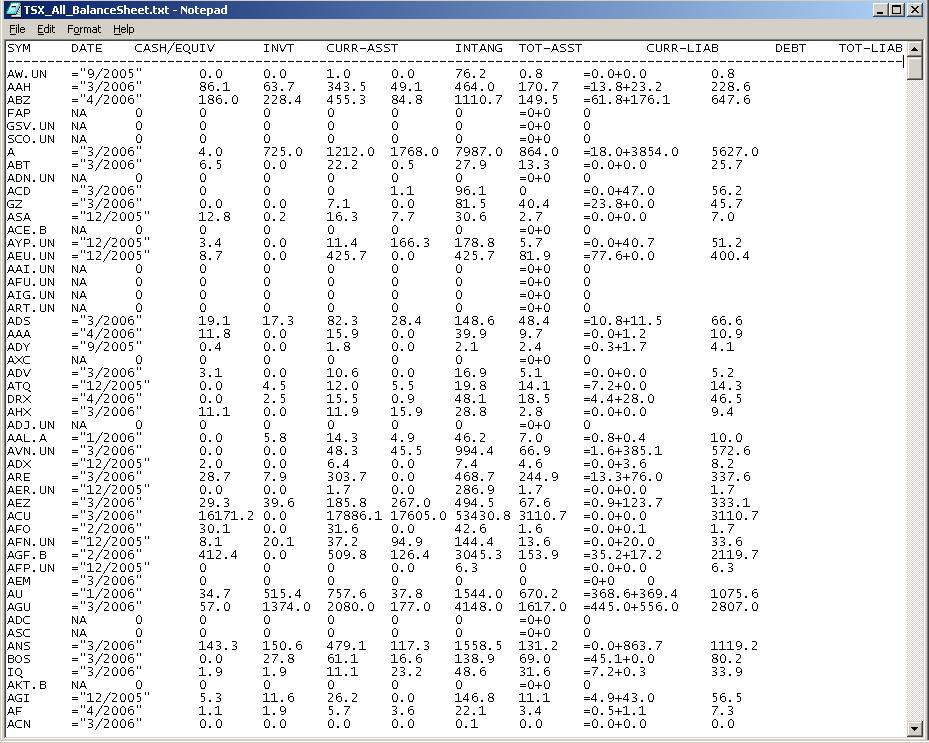
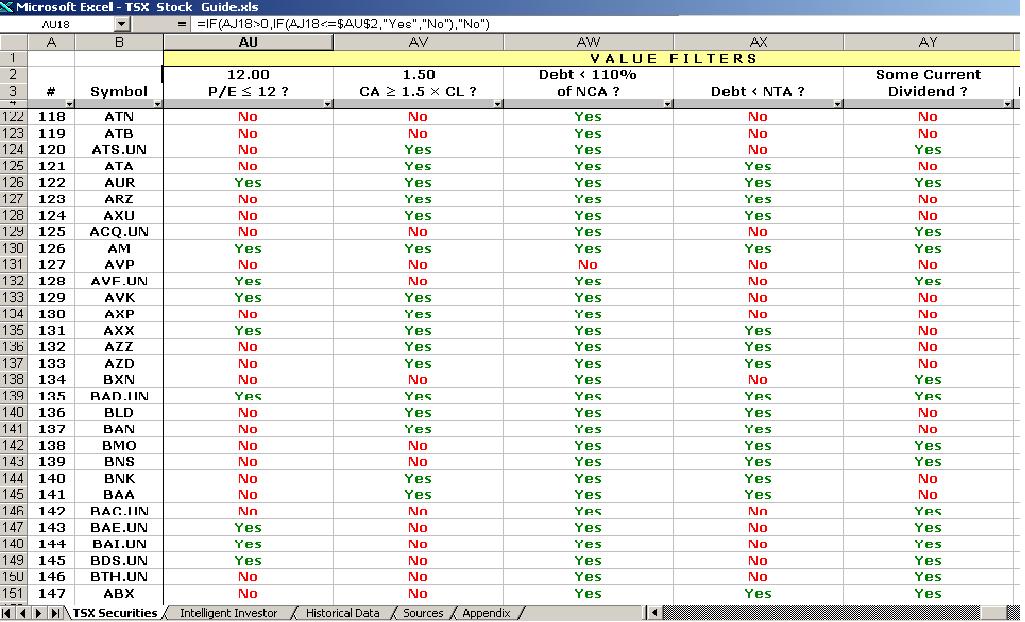
 The idea is to use various filters in the spreadsheet that will narrow down the list of potential investments based on balance sheet data. For example, you may want to eliminate all companies that are carrying a debt that is larger than their Net Tangible Assets. The filters are based on two of Benjamin Graham's books, The Intelligent Investor and Security Analysis. This way I can make decisions based on facts and figures rather than simply relying on tips and advice ... or worse - Technical Analysis!
I use the Stock Guides to narrow down the list of possible investments in a logical manner. Once a list of potential investments is generated, it is still necessary to double-check the data on the spreadsheet and to look at the original financial statements from at least the previous five years.
Below are all the fields in the Stock Guide sorted according to the category under which they belong:
Stock Market Data
Symbol: Stock Exchange symbol.Price: Last business day's closing price.
EPS: Rolling twelve-months earnings per diluted common share.
Dividend: Dividend per common share.
Shares Outstanding: Outstanding common shares.
Market Value: Price × Shares Outstanding.
Balance Sheet Data
Date As Of: Balance sheet data as at this date.
Cash & Equiv: Cash assets on balance sheet.
Inventories: Inventories on balance sheet.
Current Assets: Total current assets (i.e. cash, receivables, inventories etc).
Intangibles: Total Intangible assets (eg. goodwill) on balance sheet.
Total Assets: Total assets on balance sheet.
Current Liab: Total current liabilities on balance sheet.
Total Debt: Short-term debt + long-term debt.
Total Liab: Total liabilities on balance sheet.
Asset Values
Net Cash Assets (NCA): Cash & Equivalent – Total Liabilities.
Net Current Assets (Liquidation Value): Current Assets – Total Liabilities.
Net Tangible Assets (NTA/Book Value): Total Assets – Intangibles – Total Liabilities.
Ratio of Current Price to _ _ _
NCA: Ratio of current price to Net Cash (& Equivalent) Assets.
LQV: Ratio of current price to Net Current Assets (or Liquidation Value).
NTA: Ratio of current price to Net Tangible Assets (NTA/Book Value).
Value Ratios
P/E: Price ÷ Earnings Per Share.
E/P Yield: "Earning power on price", Earnings ÷ Price × 100.
Div. Yield: Dividend per share ÷ Price × 100.Erngs/NTA: Earnings ÷ Net Tangible Assets × 100.
CA/CL: Current Assets ÷ Current Liabilities.
NCA/Debt: Net Current Assets ÷ Total Debt.
Note: Net Current Assets = Current Assets – Current Liabilities.
Price Filters
P ≥ x: Yes if price is greater than or equal to x. Otherwise No.
P ≤ x: Yes if price is less than or equal to x. Otherwise No.
P ≤ x% of LQV: Yes if price is less than or equal to x% of the Liquidation Value. Otherwise No.
P ≤ x% of NTA: Yes if price is less than or equal to x% of Net Tangible Assets. Otherwise No.
Value Filters
P/E ≤ x: Yes if the price to earnings ratio is less than or equal to x. Otherwise No.
CA ≥ x × CL: Yes if Current Assets are greater than or equal to x times Current Liabilities. Otherwise No.
Debt < x% of NCA: Yes if Total Debt is less than x% of Net Current Assets (NCA). Otherwise No.
Note: Net Current Assets = Current Assets – Current Liabilities. This filter should only be used for Industrial companies.
Debt < NTA: Yes if Total Debt is less than Net Tangible Assets (NTA). Otherwise No.
Some Current Dividend: Yes if Dividend is greater than zero. Otherwise No.
P:NTA × P/E ≤ x: Yes if the ratio of current price to Net Tangible Assets (NTA) multiplied by the price to earnings ratio is less than or equal to x. Otherwise No.
Note: x = 22½ accepts a company trading at 1½ times book value and a P/E of 15.
Other Filters
Mkt Cap ≥ x: Yes if market capitalization is greater than or equal to x. Otherwise No.
Mkt Cap ≤ x: Yes if market capitalization is less than or equal to x. Otherwise No.
Trust or Fund: Yes if company is a Income or Business or any other trust or fund. Otherwise No.
Tags: Balance Sheet Analysis